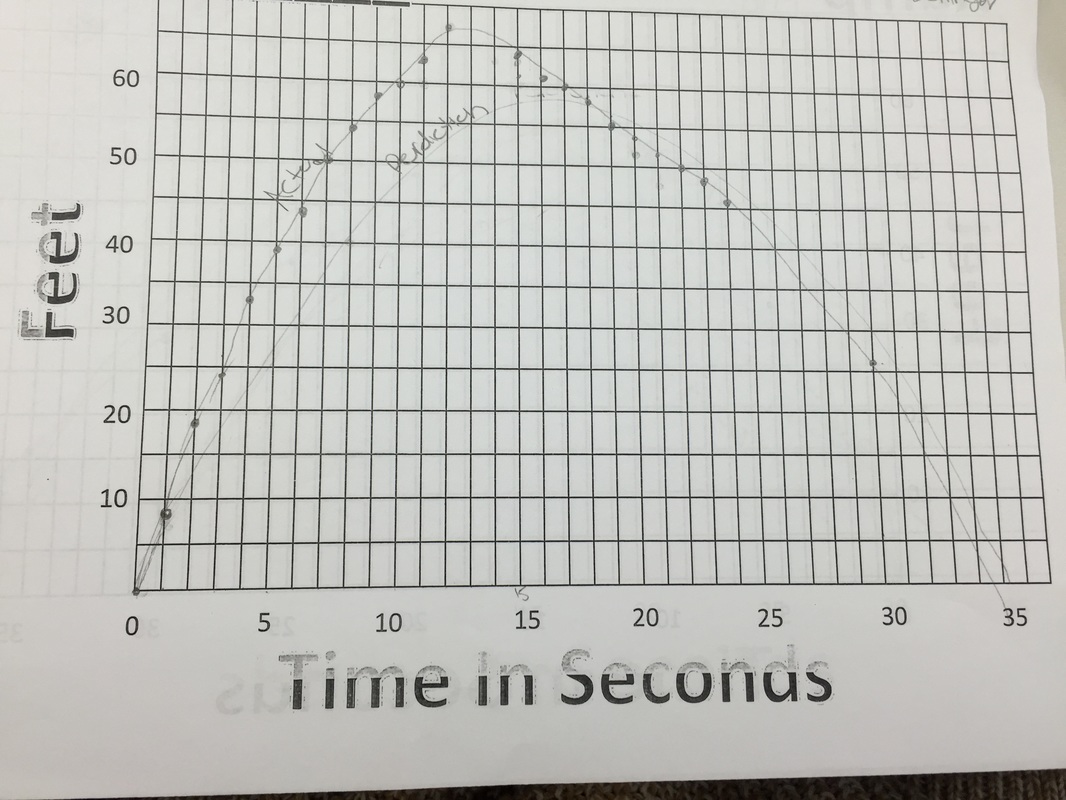
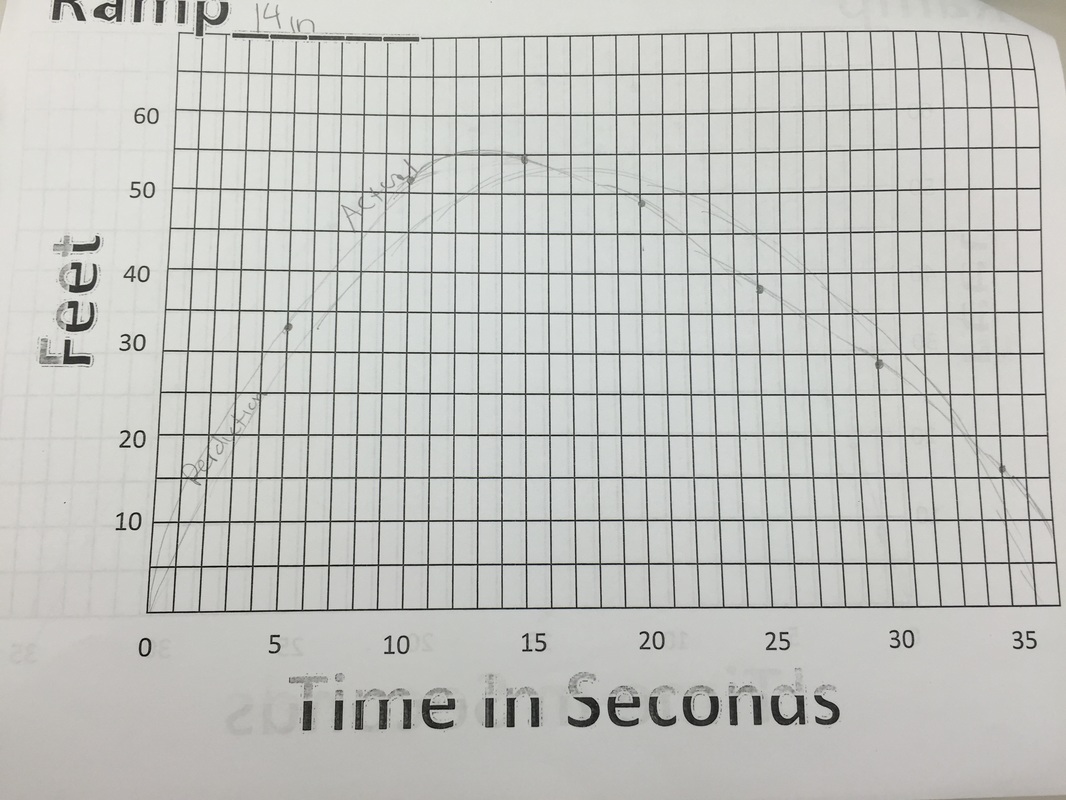
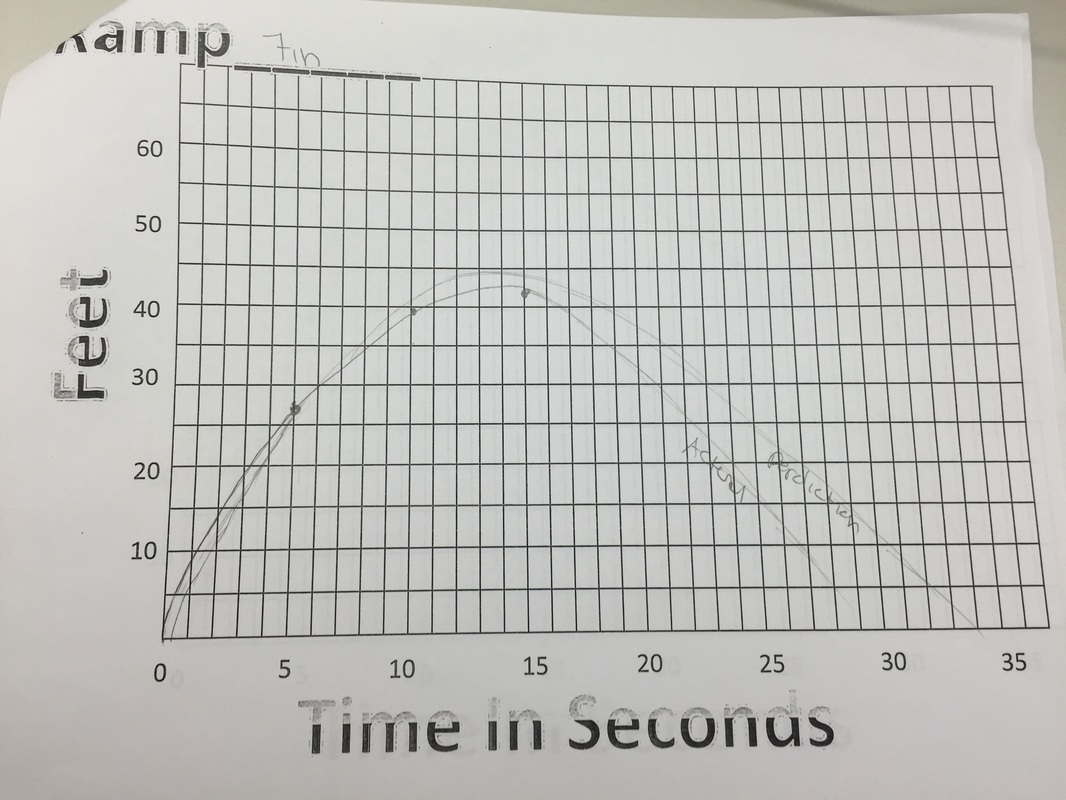
a. For the most part my predictions were kind of close. My first graph perdition was not very close in the beginning but towards the end it was very similar to the actual graph. For the 14 inch graph the prediction was also very similar, the only thing that is a little bit different was the peak of the graph was a few seconds before my perdition, other than that they were very similar. Finally, for the 7 inch graph my prediction was similar in feet and for the most part time, but at the end of the graph my perdition was over what the actual graph was. What lead me to make my perdition was I knew that the bigger ramps would have a further distance and longer time, so I would make my graphs taller and longer, and as the ramp got smaller I made the graphs have a shorter distance in a shorter amount of time.
b. The zeros of the graph represent the time in seconds of how long the skate board will travel for once it leaves the ramp. The larger ramps will result in the skateboard to travel for a longer amount of time then the ramps that are smaller.
c. The skateboard at all three ramp heights all start out with the same zero, or zero seconds. But the bigger ramps will make the skateboard travel for a longer period of time then the ramps that are smaller, and you can see this happening in the graph. The maximum represents how far the skateboard traveled. The 21 inch ramp has the farthest distance since it was the largest ramp. The 14 inch had the next biggest and was second largest ramp. And the smallest ramp which was 7 inch had the shortest distance. The minimums of the graphs are also all different. The 21 inch ramp has the largest minimum, since the ramp is the largest out of the three. The skateboard on the medium sized ramp has the second largest minimum. And finally, when the skateboard was on the smallest ramp, which was 7 inches, the minimum was the smallest.
d. When comparing the rise and run of all three of the graphs, each graph has a different slope. The graph that showed the skateboard going down the largest ramp, which was 21 inches, had a larger slope than the other two graphs. The 14 inch ramp, which was next largest in size, had the second biggest slope. And the smallest ramp that was 7 inches had the smallest slope out of the three. The reasoning behind this is because ramps that are larger will cause the skateboard to travel longer in distance and longer in time, making the graphs have a larger rise and longer run. Also, the larger ramps will cause the skateboard to go at a faster rate, which will make the graph to rise faster. The graphs that show the smaller ramps will also be falling faster since they went a shorter distance and the skateboard continued backwards.
 RSS Feed
