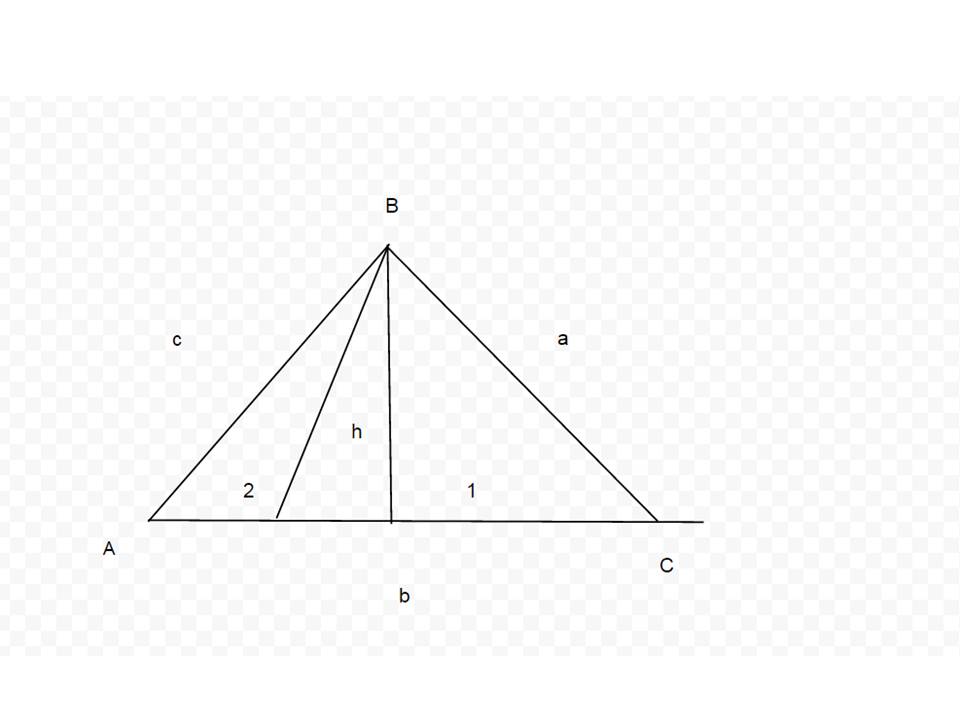
SSA is considered ambiguous because it can be interpreted in more than one way, when using the law of sines you when given an angle measurement and two side lengths, you could find more than one answer or possibly no answers. When using this law, to find one solution, you first need to start out by finding the height of the triangle, to do this you need to take the sine of the given angle measurement and the side length that is adjacent to the angle measure. Next, you use the other given side length, and draw two lines on each side of the height. Now you separate the two angles that are formed and you use the law of sines for each angle to find the missing sides and angles. When using this way to solve the triangles, the given angle has to be an acute angle or else there will be no solutions.
For my trig verification I started off with sec^2x. Next I used the trick of switching everything to either sines or cosines and switched sec to cosine. Once I did that I used another trig identity 1-sin^2x, and substituted that in for cos. On the top of the fraction I put in tanx over tanx. Lastly, I once again changed everything to sines and cosines, and changed it to sinx/cosx over sinx/cosx.
A radian is a unit of angle, equal to an angle at the center of a circle, whose arc length is equal to the radius. In other words the radian is the angle that is created by the radius of a circle. The unit circle is a circle who has a radius of one, and is used to understand sines and cosines found in right triangles. By using right triangles, you can go around the unit circle and find the radian measures in the circle according to the origin. The formula for circumference can either be 2 pi radius or pi diameter, how this relates to radian measure is that the radius or diameter of a circle is used to create the angle of a triangle that is located in the unit circle. Radians and degrees can both mean the same thing, in a unit circle they are both the measure of the angle, both can be converted from and to each other. In my opinion I prefer the degrees measurement because it is easier to visualize than the radian measure. However, radians are more mathematically pure because the are what we use most often in formulas.
Government subsidized loans are available to undergraduate students with financial needs. The school determines the amount of money you can borrow, and the amount may not exceed your financial need. They government pays the interest on a subsidized loan while you are in school at least half the time, for the first six months after you leave school, and during a period of deferment. Government non-subsidized loans are available to undergraduate and graduate students, and there is no requirement to demonstrate financial need. The school also determines the amount you can borrow based on you cost of attendance and other financial aid you receive. You are responsible for you the interest during all periods, and if you choose not to pay during these periods your interest will accumulate and be capitalized. Bank loans have a low interest rare and you are able to take out as much as you want, depending on your credit, you may also need a cosigner. Credit union loans are pretty much the same as bank loan but usually have a higher interest rate. Interest rates for subsidized loan are usually around 4.29%, for non-subsidized loans, the interest rate also is around 4.29%. Bank loans also have interest rates around 3-4%. Credit union loans can have interest rates of 1-20%. None of these numbers are exacts, they depend on lots of things. Your interest rates are calculated based on how much money you are taking out and the length of time that they are being taken out. From my findings, it will take a little over 4 year to pay back a $20,000 loan with an interest rate of 4.20%
It would take about 42 folds in half's for the stack of paper to reach the moon. However, this is very unrealistic, a person can only fold a piece of paper about six or seven times, after that the paper becomes very small and thick and too hard to continue to fold in half. The stack of paper would be very thin after this many folds, and this matters because after 42 folds you would not be able to even see the stack of paper anymore.
Even and odd functions are similar because they both are symmetrical in some way. But they are not symmetrical in the same way. Even functions are symmetrical with the y-axis and odd functions are symmetrical with the origin of the graph (flip over y and then x.) Also ,for even functions for every -x value f(-x)=f(x), if that is true for the function that means it is a even function. But for odd functions for every -x value f(-x)=-f(x). If those are true for the functions then they are odd. To check if a function is even or odd use for every -x value f(-x)=f(x) for even functions. And use for every -x value f(-x)=-f(x) to check if it is an odd function. No, there is not always a family of functions that are always even, though parabolas are almost always even unless you move it the the right or left. No, there are not any families of functions that are always odd, but some are more consistently odd then others. I still could use some practice verifying that a function is even or odd.
The type of function that it appears to be is a exponential growth function. The domain of the function is all real numbers. The range of the function is f(x) is greater than .4.
To make the mathematical model above, you first need to plot points. When did this, I chose to make five points and put four of them on each of the basketballs, that was I know the line that had to go through each of the points was accurately show if the ball was going to go in the hoop, I then added one other point that was not on one of the pictures of the basketball to show where the ball would of went when it was still continuing . Next, I typed my points into my spreadsheet, so I could then make a list of all my points. I then used the input space and typed in fitpoly, and added my list 1, as well as the highest degree of the polynomial, which was three. Finally, I hit add and the line of best fit showed up on my picture that I added to the graph earlier. And as you can see in the graph above, the basketball does make it into the hoop, making the ball will go in the hoop my prediction.
a. For the most part my predictions were kind of close. My first graph perdition was not very close in the beginning but towards the end it was very similar to the actual graph. For the 14 inch graph the prediction was also very similar, the only thing that is a little bit different was the peak of the graph was a few seconds before my perdition, other than that they were very similar. Finally, for the 7 inch graph my prediction was similar in feet and for the most part time, but at the end of the graph my perdition was over what the actual graph was. What lead me to make my perdition was I knew that the bigger ramps would have a further distance and longer time, so I would make my graphs taller and longer, and as the ramp got smaller I made the graphs have a shorter distance in a shorter amount of time.
b. The zeros of the graph represent the time in seconds of how long the skate board will travel for once it leaves the ramp. The larger ramps will result in the skateboard to travel for a longer amount of time then the ramps that are smaller. c. The skateboard at all three ramp heights all start out with the same zero, or zero seconds. But the bigger ramps will make the skateboard travel for a longer period of time then the ramps that are smaller, and you can see this happening in the graph. The maximum represents how far the skateboard traveled. The 21 inch ramp has the farthest distance since it was the largest ramp. The 14 inch had the next biggest and was second largest ramp. And the smallest ramp which was 7 inch had the shortest distance. The minimums of the graphs are also all different. The 21 inch ramp has the largest minimum, since the ramp is the largest out of the three. The skateboard on the medium sized ramp has the second largest minimum. And finally, when the skateboard was on the smallest ramp, which was 7 inches, the minimum was the smallest. d. When comparing the rise and run of all three of the graphs, each graph has a different slope. The graph that showed the skateboard going down the largest ramp, which was 21 inches, had a larger slope than the other two graphs. The 14 inch ramp, which was next largest in size, had the second biggest slope. And the smallest ramp that was 7 inches had the smallest slope out of the three. The reasoning behind this is because ramps that are larger will cause the skateboard to travel longer in distance and longer in time, making the graphs have a larger rise and longer run. Also, the larger ramps will cause the skateboard to go at a faster rate, which will make the graph to rise faster. The graphs that show the smaller ramps will also be falling faster since they went a shorter distance and the skateboard continued backwards. 1.This graph shows that the boy scout is raising the flag at a constant rate, meaning that for every second the flag is hoisted into the hair it increase the distance by the same amount.
The next graph shows that the flag was raised quickly at first but then slowly towards the end. Graph c shows that the flag is being pulled up but then stays at the same height for a few seconds. You can probably imagine that the boy scout is reaching up and pulling down and then reaching up with the other hand and pulling it down once again. Here the flag goes up slowly at first and then starts to speed up at the end. This graph shows the flag being hoisted up slowly up first, then gaining speed, and finally slowing down at the end again. The final graph shows the flag being nowhere, but then the flag is at every height at the same time, then it is nowhere once again. 2. In my opinion, the most realistic graph is graph c.I think this because the graph shows that every time the flag is being hoisted up there is a brief amount of time where the flag remains at a constant height. You can imagine that the boy scout is using both hands the pull the flag up, so every time the flag is hoisted up, the boy brings up his other hand to continue hoisting the flag. 3. The graph that is the least realistic is graph f. Graph f is least realistic because the flag begins at being nowhere, then it is at every height, and then nowhere at the end again. |
AuthorWrite something about yourself. No need to be fancy, just an overview. Archives
November 2015
Categories |